Welcome to the second edition of the Pittsburgh Equity in Architecture Report! Our first report was generated back in 2019, and was an insightful free resource for the Pittsburgh community. The 2019 report released on December 13, 2019. The Pittsburgh area just 3 months later was shut down due to a pandemic. This caused the industry to be in for a bit of a rollercoaster ride which changed the profession. Not only were there economic impacts like past economic down turns, but there were new challenges. To name a few, material shortages came into play for projects under construction. A more empathic view of sick time and needing to not force your way through work when sick. And possibly the biggest shift, the ability to still be amazing at our jobs in a hybrid or remote capacity. The industry and firms are still working through adjustments, and it may take years to truly see the impact these changes make on the profession.
Fast forward 3 years, it was time to take a look at where we are today. The 2023 Report was released EXACTLY 3 years after former Pittsburgh Mayor Peduto declared a state of emergency due to covid-19 for the city of Pittsburgh (March 13, 2020).
Now, let me give you a sneak peak of some of the results gathered in the 33-page report.
Survey
The survey itself was launched on January 5, 2023, and was live through February 10, 2023. During that time the survey was shared through social media, emails, newsletters, events, etc. Before we go further, I wanted to take a moment to thank everyone that participated and spread the word around our community.
A special thank you to local organizations that supported the survey through helping with distribution including AIA Pittsburgh, AIA Pittsburgh Equity Committee, AIA Pittsburgh YAF, NOMA, Women In Design, IIDA, and other organizations that I may not be aware of that also shared the survey. The participation level would not be where it is without you!
2019: 160 total participants
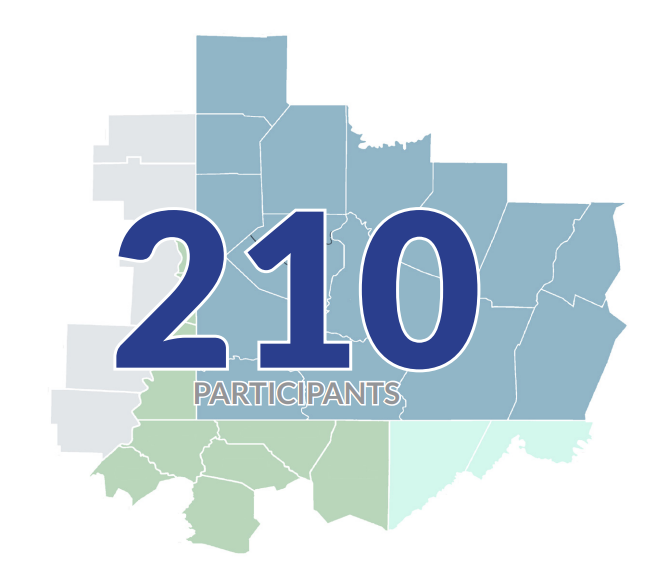
2023: 210 total participants; 165 architectural and 45 interior designers.
Survey Questions
We asked the following questions to ALL participants:
What is the zip code of your office location? (Only used to confirm participants were from our region)
What is your gender?
What is your ethnicity?
What is your age?
What are your total number of years’ experience in the architectural field?
How many office locations does your company have?
What type of company do you work for?
What is your current salary (excluding bonuses)?
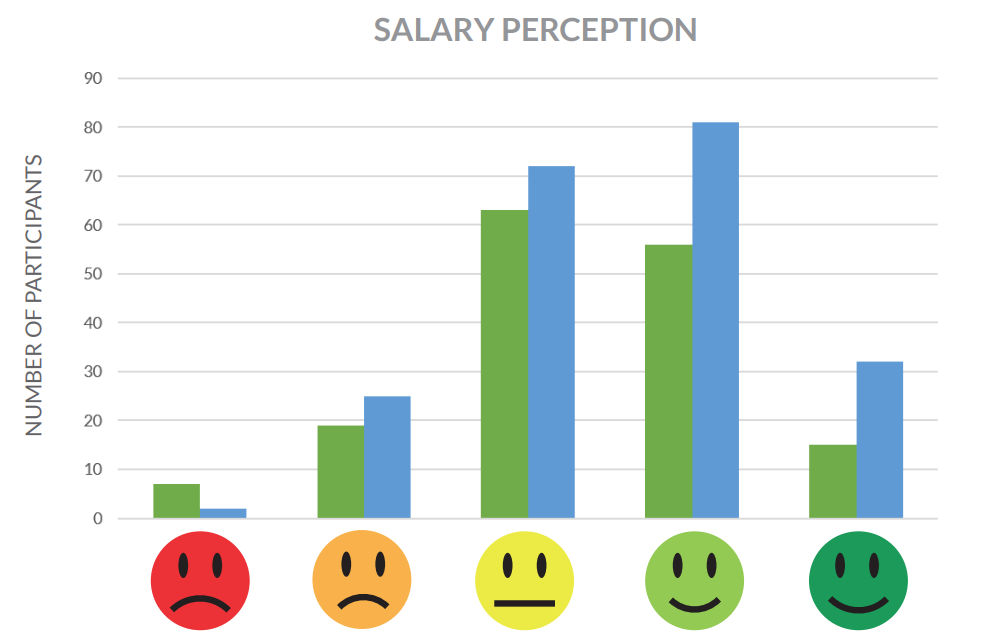
How do you feel about your salary?
1= very dissatisfied • • • 5= very satisfied
Do you typically get a yearly bonus?
Have you changed firms since April 1, 2020?
roughly the time the Pittsburgh region shut down due to Covid-19.
What does your typical work week look like with the number of days in the office?
If you could choose, how many days would you like to be in the office?
How many hours do you typically work per week?
How do you feel about your work-life balance?
1= very dissatisfied • • • 5= very satisfied
What are the top 5 benefits you look for in a company?
Provided a list to choose from as well as an open-ended section
Are you an architect/architectural staff, or interior designer taking this survey?
This is where the survey would take you into professional specific questions.
We asked the following questions to architectural participants only:
Are you a licensed Architect?
What is your current job title?
Since graduating from college, how many years did it take you to become a licensed architect?
We asked the following questions to designer participants only:
How many interior designers are in your local office?
What is your current job title?
Are you NCIDQ certified?
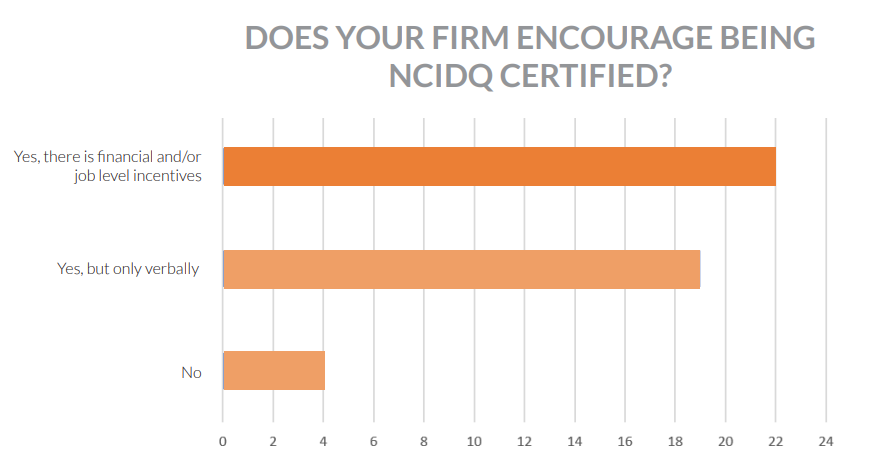
Does your firm encourage being NCIDQ certified?
Do you feel interior designers are equally represented in leadership positions within your firm?
1= strong disagree • • • 5= strongly agree
Do you feel that your role expands beyond material selection as a decision maker in project overall design concept?
1= strong disagree • • • 5= strongly agree
What type of roles do you typically do?
Overall Demographics
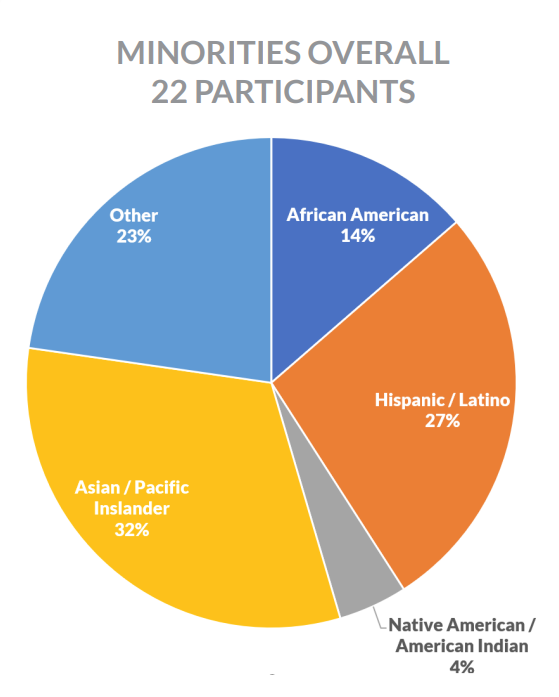
We had 11% of our participants as minorities, which is close to NOMA’s national research identifying just over 11% of architects are non-white. We did have a number of participants provide their specific ethnicity. For confidentiality purposes, we did create an “other” category. We did not want to highlight individuals in case they were not comfortable with that being shared.
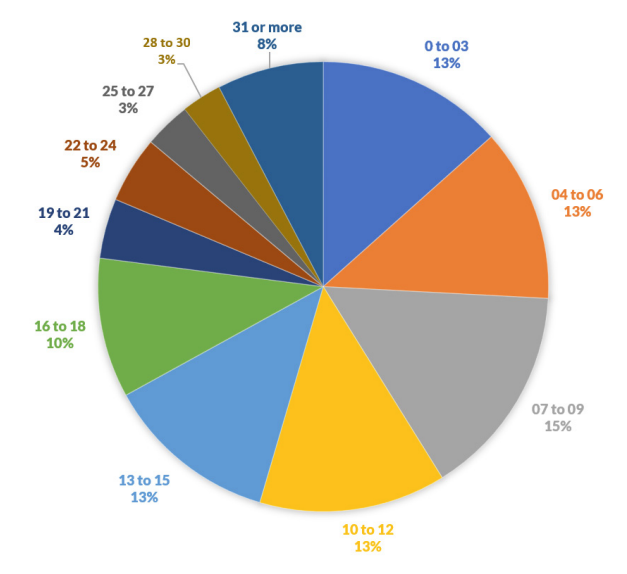
We had a variety of experience levels participate. This gave the survey opportunities to dive into all the job titles identified by the AIA. We will note that since there was a smaller sampling of Designer participants, we were not able to provide any information those that are not NCIDQ and have 6-7 years of experience. All other categories for Architects and Designers were able to be shared.
Gender, on the architectural side had almost a perfect 50/50 split. For the Designers, we had 93% females. The architectural participants we were able to provide an architectural equal pay gap analysis chart within the report. Unfortunately for the Designers we were unable to do an equal pay gap analysis due to the lack of data on male counterparts.
Companies
72% of our participants are currently employed at a purely architectural design firm. (This EXCLUDES multi-disciplinary firms) There were a variety of firm sizes included in this data. If we had a larger sample size, we could study more variations to understand if firm size changes the salary ranges; However, we could not do that this year. We did have a majority of participants work in firms with 21-100 people in their Pittsburgh office. 37% of participants reported their company only had 1 office location. Check out the full report to see more of the breakdown.
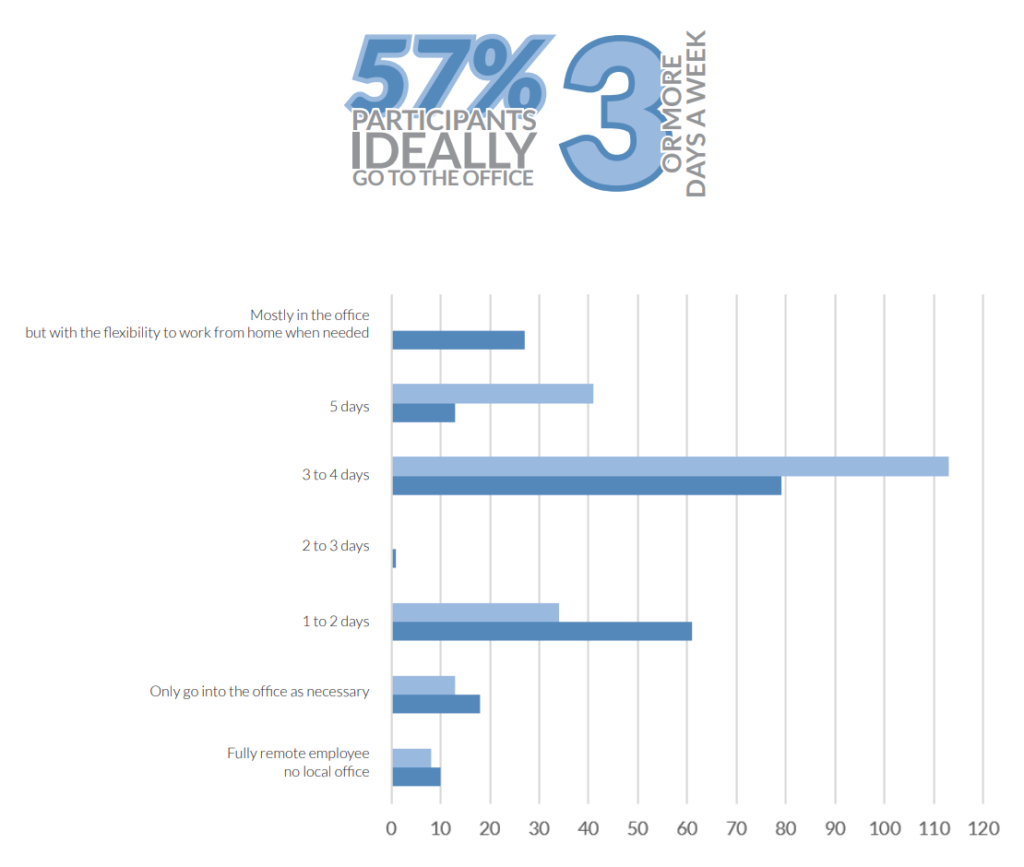
We also wanted to provide some input from our community on what firms are doing regarding hybrid work. We asked what people are doing now and what they would prefer in an ideal world. It is important to note that everyone has their own situation that guides their preference. It was overwhelming the response to needing flexibility not only in the hybrid work question, but also in the top benefits question. In the end, less than 60% of participants ideally want to go to the office 3 or more days a week.
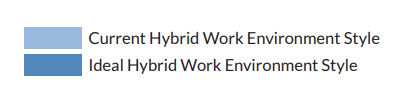
We also asked participants to select their top 5 benefits they look for within a firm, excluding salary, firm culture and design work. It was interesting to see that not everyone selected 5. We had multiple participants only select 2 or 3. Check out the full report to see the counts and the write in responses.
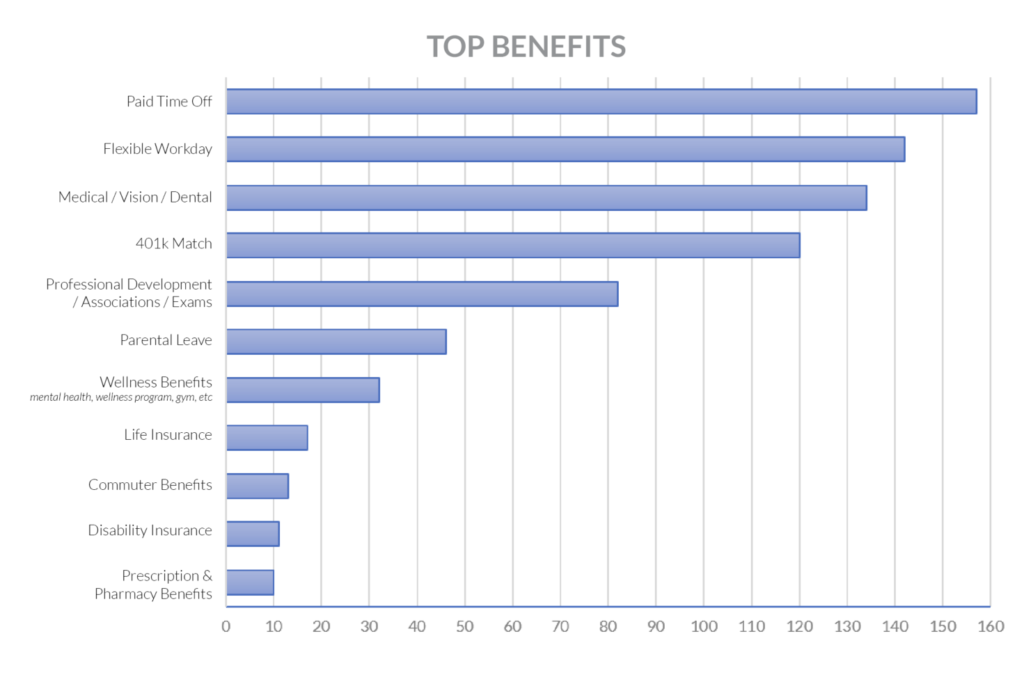
An interesting question that we were asked to include from Designers was, “do you feel designers are equally represented in leadership positions within your firm?” We heard from multiple Designers that this does factor into their decision-making process when looking for a new firm.
Licensure
It is not an easy process getting licensed. It takes time and commitment to get through everything and squeeze it into busy days. We ask about licensure because it is often associated with a different glass ceiling as far as salaries. Most firms also offer a salary increase upon being a Registered Architect. For Designers, when we identify licensed Designers in the report, we are referring to NCIDQ. 68.9% of the architectural participants are Registered Architects. 56% of the Designer participants are NCIDQ. However, for Designers 51% of the participants did NOT receive a financial or job level incentive for having their NCIDQ.
Perception
I am an advocate for transparency because it helps with perception. I also believe that one should not “expect” a specific salary based on years of experience. Everyone has their own strengths/weaknesses, experiences, knowledge base, expertise, responsibility, motivation, etc. There will always be a salary range based on various factors. However, being transparent about salaries can help provide motivation to perform better, and better understanding of perception. For example, if you are provided feedback that you are underperforming. If you knew the potential salary you could be making, would that motivate you to work on that feedback this year? If it is not salary motivated, it may be time to find a different firm that aligns with your goals, office culture, or design work.
This is the participant’s perception of their salary. We also looked back at a similar chart from the 2019 Report. It does look like that there has been a shift in perception. We did not ask for particular reasons participants felt this way so we can’t make any formal conclusions. However, we DO know that 34.4% of participants changed firms since April 2020. Typically, when you change jobs, significant salary increases occur, and lead to more salary satisfaction.
Before you download the report, what is your current perception of your salary?
I recommend taking note of that BEFORE you review the numbers within the report. Then reflect back AFTER seeing the report. Are you happier after seeing the numbers? Or are you finding yourself more dissatisfied?
Salary
The salary section is the largest portion of the report at 14 pages, and often what brings people to review the material. We are always surprised by the number of people that are interested in reading the report but not interested in participating in the 100% anonymous survey.
We hope that these reports help break down the barriers of people being afraid to share information, encourage people to participate in surveys like this and the AIA’s national survey, and encourage firms to have more transparency.
This year we also wanted to reflect on the AIA compensation calculator. It can be hard to know where Pittsburgh fits into that resource, correctly. We overlaid our data and our local AIA data to try and help show some patterns. There are some patterns among younger staff, but it changes for more senior staff. Check out the Report to see the full overlap.
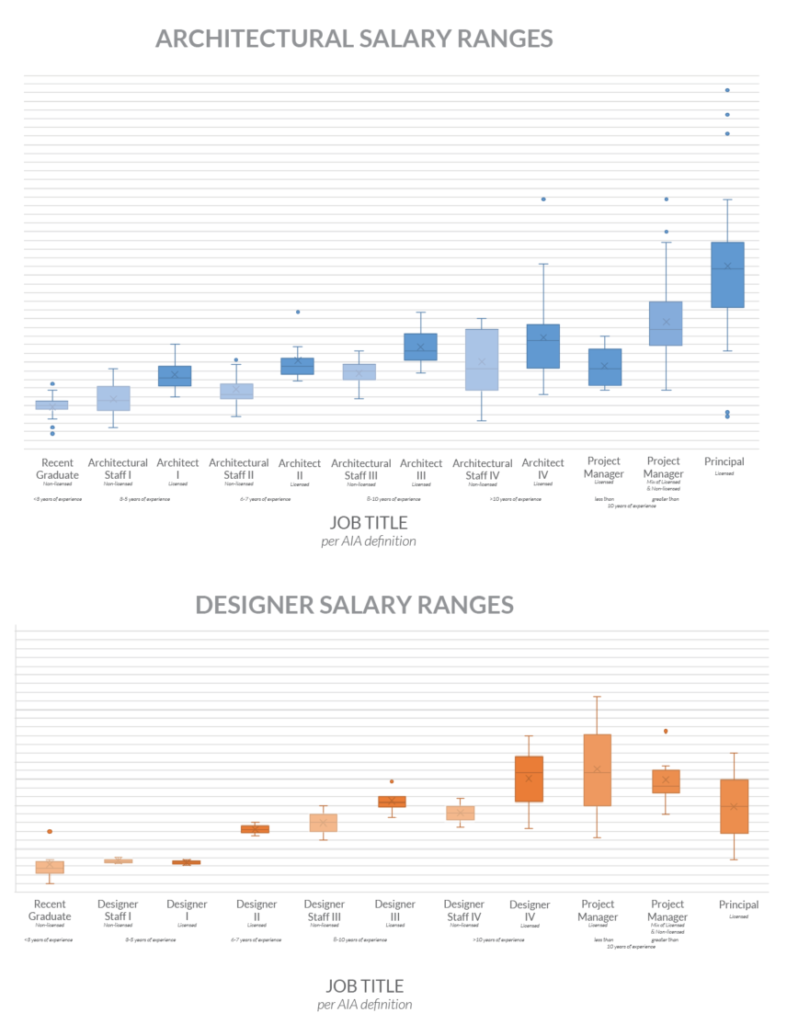
Here is a sneak peek at the breakdown. Check out the full report to see the numbers.
Written by
Katelyn Rossier, AIA, LSSBB